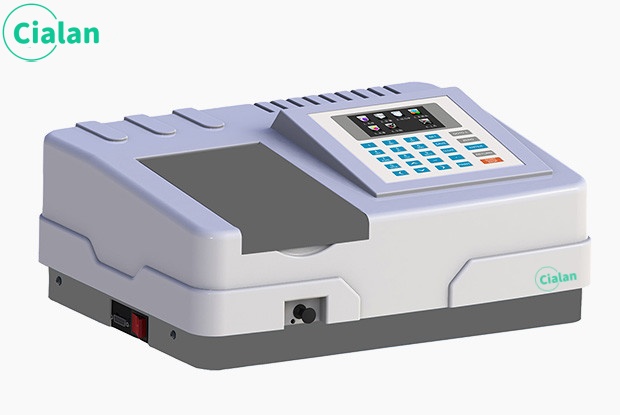
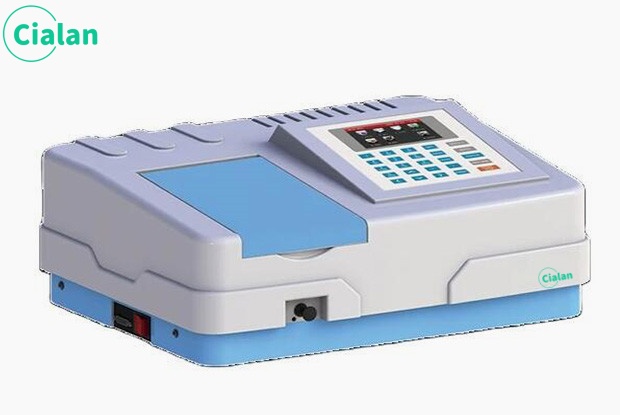
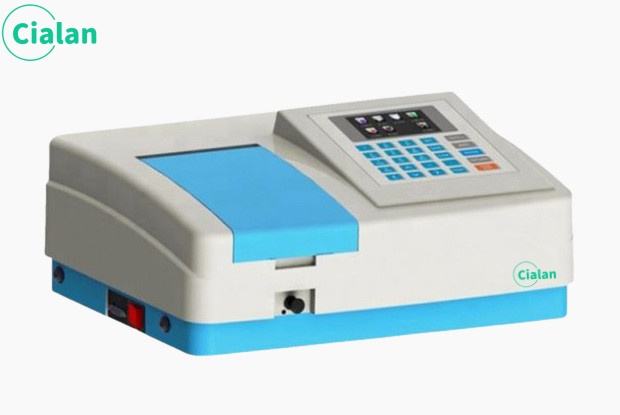
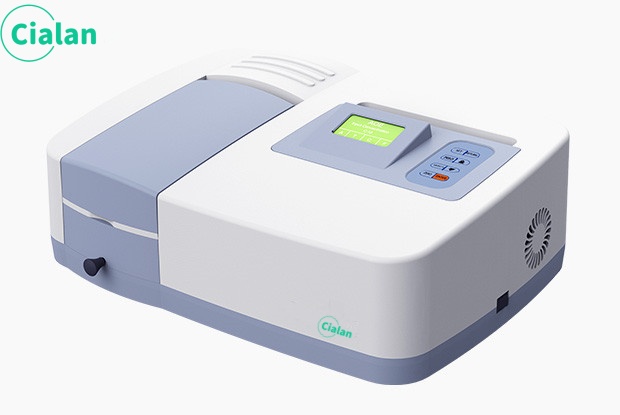
Main technical indicators of UV-visible spectrophotometer.
Main technical indicators of UV-visible spectrophotometer.
1. Optical system: generally refers to the structural form of the optical system. At present, the two structures commonly used in the international and domestic photometer industry are self-calibrating type and CT type;
2. Wavelength range: refers to the difference between the maximum and minimum wavelengths that the photometer can test;
3. Wavelength accuracy: How close the wavelength displayed by the instrument is to the real wavelength, that is, the difference between the wavelength set by the instrument and the actual wavelength. Each photometer must check wavelength accuracy at many wavelength points;
4. Wavelength repeatability: Wavelength repeatability is the ability of the instrument to return to the original wavelength. It reflects the stability of the wavelength drive machinery and the entire instrument;
5. Spectral bandwidth (sensitivity, resolution): refers to the energy half-width detected on the detector when a peak spectral band passes through the monochromator and exits the slit. It is expressed in the wavelength unit nm. Understand this from another perspective The concept will be easier to understand: First of all, the slit of the monochromator not only represents the physical size or geometric size of the slit, it also represents the optical meaning, which is the spectral bandwidth. We know that the light from the monochromator is not complete. It is light of a single wavelength, but a narrow spectral band arranged in order of wavelength.
The number of wavelengths contained in this spectral band is represented by spectral bandwidth. The spectral bandwidth directly reflects the monochromaticity of the light coming out of the monochromator. This indicator is very similar to the resolution and sensitivity of the instrument, but different. They reflect the performance of the photometer from different aspects. Resolution refers to the ability of an instrument to distinguish the size of two adjacent wavelengths. If two pulses are input to the input end of the instrument at two adjacent wavelengths, the analog signal detected on the detector of the instrument will, if the minimum value of the signal is low, If the wavelength is less than 80% of the maximum value, the two wavelengths are considered to be distinguishable according to the Rayleigh criterion. In actual measurement, benzene vapor is usually used for measurement (peak and valley between 258.9nm and 259.3nm). Sensitivity refers to the change in signal on the detector when the concentration changes by one unit when measuring low concentrations.
It is affected by the calibration curve (the concentration of the standard curve is the horizontal axis, the absorbance is the vertical axis) and the precision of the instrument itself. limit. When the precision of the two measurement methods is the same, the greater the slope of the calibration curve, the more sensitive it is; when the slopes are equal, the higher the precision, the better the sensitivity. It should be pointed out that in order to obtain accurate test results, the ratio between the spectral bandwidth of the instrument (Spectral Bandwith SBW) and the natural bandwidth of the analyzed sample (Natural Bandwidth NBW) should be less than 0.1, so that a measurement accuracy of more than 99.5% can be obtained. ;
6. Stray light: Stray light is a signal generated by light of non-selected wavelengths irradiating the detector. It is an important source of photometer analysis errors. Stray light will limit the accuracy of high-concentration solution analysis. Stray light is expressed as T%;
7. Photometric range: refers to the test range of the photometer when meeting various technical indicators, represented by A or T;
8. Photometric accuracy: refers to the degree to which the average value of multiple measurements is consistent with the true value;
9. Photometric repeatability (Photometric precision): refers to the degree of agreement between the results of multiple parallel measurements under the same conditions;
10. Baseline flatness: refers to the distribution of instrument noise within the full wavelength range;
11. Drift: refers to the degree to which the instrument deviates from the starting value over time. It depends on the stability of the light source, the stability of the electrical devices, etc. For single-beam instruments, the length of power-on warm-up time has a great impact on drift;
12. Noise: refers to the sum of non-useful signals detected by the instrument, which is relative to the signal. Generally, there are two sources of noise in a spectrophotometer. One is from the light source, and the other is from the inherent electronic noise inside the instrument, such as power supply, amplifier, AD converter, etc. To reduce noise and improve signal-to-noise ratio, a good electrical design is necessary. Noise affects the measurement repeatability under low concentration tests and also affects the test accuracy. The noise can be partially eliminated by averaging multiple measurements.


